


index
Despite the bearish outlook, Bitcoin (BTC) bounced after reaching support at $60,000 on Friday, with buyers entering the market and pushing the price higher.
In the short term, analysts expect Bitcoin to remain in the $60,000 to $64,000 range, with a possible breakout of this range in the coming weeks.
Fight between a bull and a bear
Last week, Bitcoin fell slightly below the $60,000 support level. However, the low levels attracted a large number of buyers, and an attempt to start a recovery sent BTC surging past $63,000. Looking at the bigger picture, Bitcoin is still stuck between $57,000 and $73,000, indicating an intense fight between bulls and bears. At the moment, it is difficult to predict a bullish or bearish breakout.
Investors themselves are conflicted about Bitcoin’s future price action, with some, such as former PayPal CEO Peter Thiel, saying there isn’t much room for Bitcoin to go higher. Thiel said:
“I’m not sure it’s going to go up that dramatically from here. The ETF edition is out and I don’t know who’s buying it. It’s probably still going to go up, but it’s going to be very volatile and it’s going to be a bumpy ride.”
However, some investors, such as popular trader BitQuant, are bullish on Bitcoin’s prospects. In a post on X, the trader said Bitcoin could reach $95,000.
Bitcoin (BTC) Price Analysis
Bitcoin (BTC) made a strong recovery over the weekend after hitting a low of $58,474 early last week. However, strong support at this level allowed BTC to rally back above $60,000 and settle at $60,330. With bulls defending this level, BTC was able to post a 2.52% gain on Tuesday. However, bearish sentiment returned on Wednesday as the price fell to $60,854 before rising 1.38% to trade at $61,691 on Thursday. BTC returned to the red on Friday as significant selling pressure pushed the price back to $60,412 as sellers attempted to push the price back below the $60,000 support level.
Bitcoin (BTC) rebounded significantly from this level over the weekend, with buyers pushing it as high as $60,987 on Saturday. Sunday saw an even bigger increase, with BTC rising 2.88% to $62,741. This caused BTC to break through and close the significant resistance level of $62,500. The current session sees BTC trading above $63,000 as buyers attempt to break above $64,000.

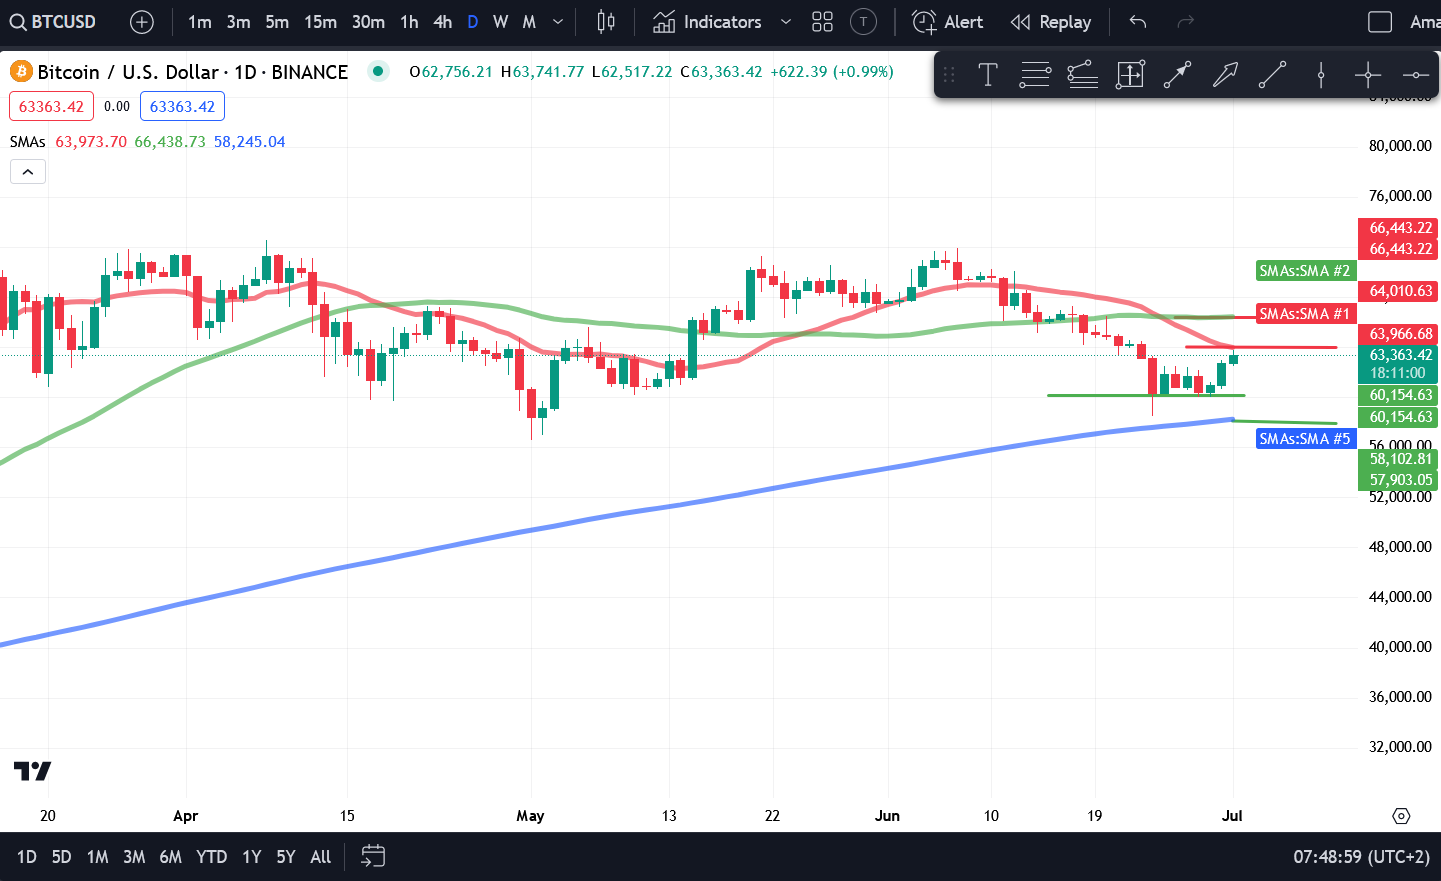
Source: TradingView
Looking at the price chart, we can see that BTC has crossed the resistance level of $62,500. The next major resistance level is $64,000, which also includes the 20-day SMA. If Bitcoin can get above $64,000, we could see an upward trend towards $66,500. However, if sentiment turns bearish, BTC could return to the $60,000 support level. If sellers are able to breach this level of support, BTC could fall to $58,000, where the 200-day SMA could act as a dynamic support level.
Ethereum (ETH) price analysis
Ethereum (ETH) has been in a downtrend since early June, as seen on the price chart. The cryptocurrency fell to the support level of $3,350 last Monday. However, since reaching this level, ETH has bounced back strongly and almost recovered its previous losses. ETH has been trading between $3,350 and $3,500 for the past week, with both support and resistance levels holding firm. Buyers pushed ETH up 1.28% on Tuesday, but were unable to push the price above $3,400, and ETH settled at $3,395. Sellers regained control on Wednesday, as ETH fell to $3,369. ETH made a strong recovery on Thursday, posting gains of $3,449. However, sellers were able to defend the $3,500 level, and the price fell to $3,376 on Friday.

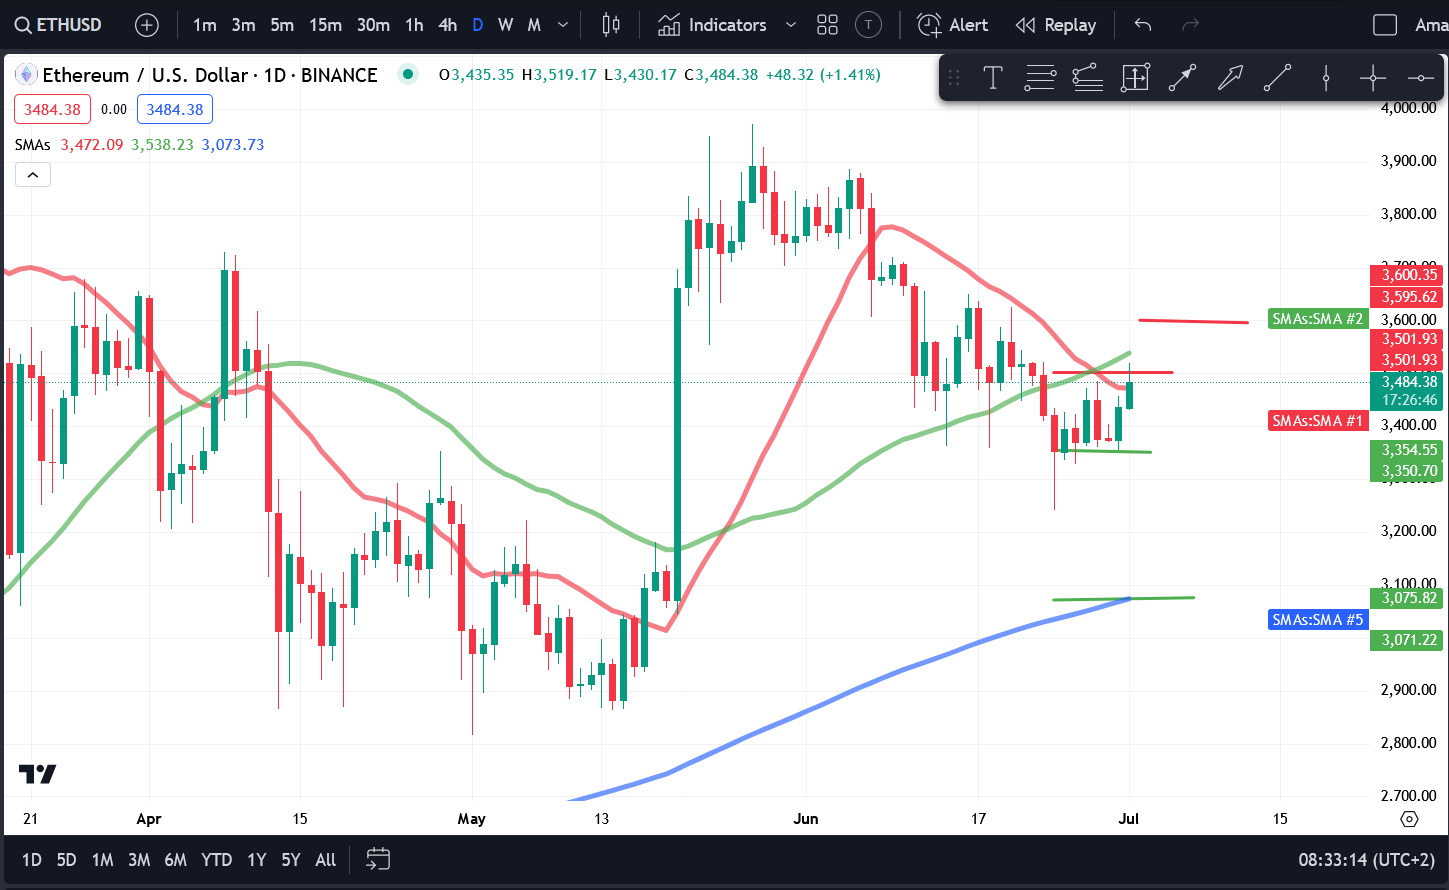
Source: TradingView
The decline came after another attempt by buyers to push ETH above the $3,400 mark, which saw ETH reach a daily high of $3,486 before sellers were able to reverse the trend. The weekend started weakly, with ETH posting a slight decline. However, ETH made a strong recovery on Sunday, rising 1.82% to close above the important $3,400 mark at $3,436. In the current session, ETH has broken above its 20-day SMA, with the current price at $3,484. Buyers are trying to push ETH above the $3,500 resistance, but so far sellers have defended this level, sending ETH lower.
If ETH can rise above $3,500, it could rise to $3,600. A reversal would cause ETH to slide below its 20-day SMA and towards the $3,350 support level. If there is further selling pressure, ETH could fall to $3,100.
BNB Coin (BNB) Price Analysis
BNB Coin (BNB) had a mixed week as sellers attempted to drive the price below the $560 support zone after falling as low as $568 last Monday. BNB reached a low of $551 before buyers were able to push the price back up. On Tuesday, BNB saw a strong rebound, rising 1.78% to $578. Wednesday's highly volatile session saw the price fall to $572. Sellers attempted to bring BNB back below $560 on Thursday. However, buyers entered the market at lower levels and BNB eventually rose 1.48% to $581.
There was significant selling pressure on Friday, with BNB dropping 2.51% to $566. Despite the selling pressure, BNB’s $560 support held, and the cryptocurrency recorded a modest gain on Saturday. On Sunday, BNB rose 2.12% to $581, ending the weekend strong. In the current session, BNB is up 0.40% as buyers attempt to push the price above the 20-day SMA and $600.

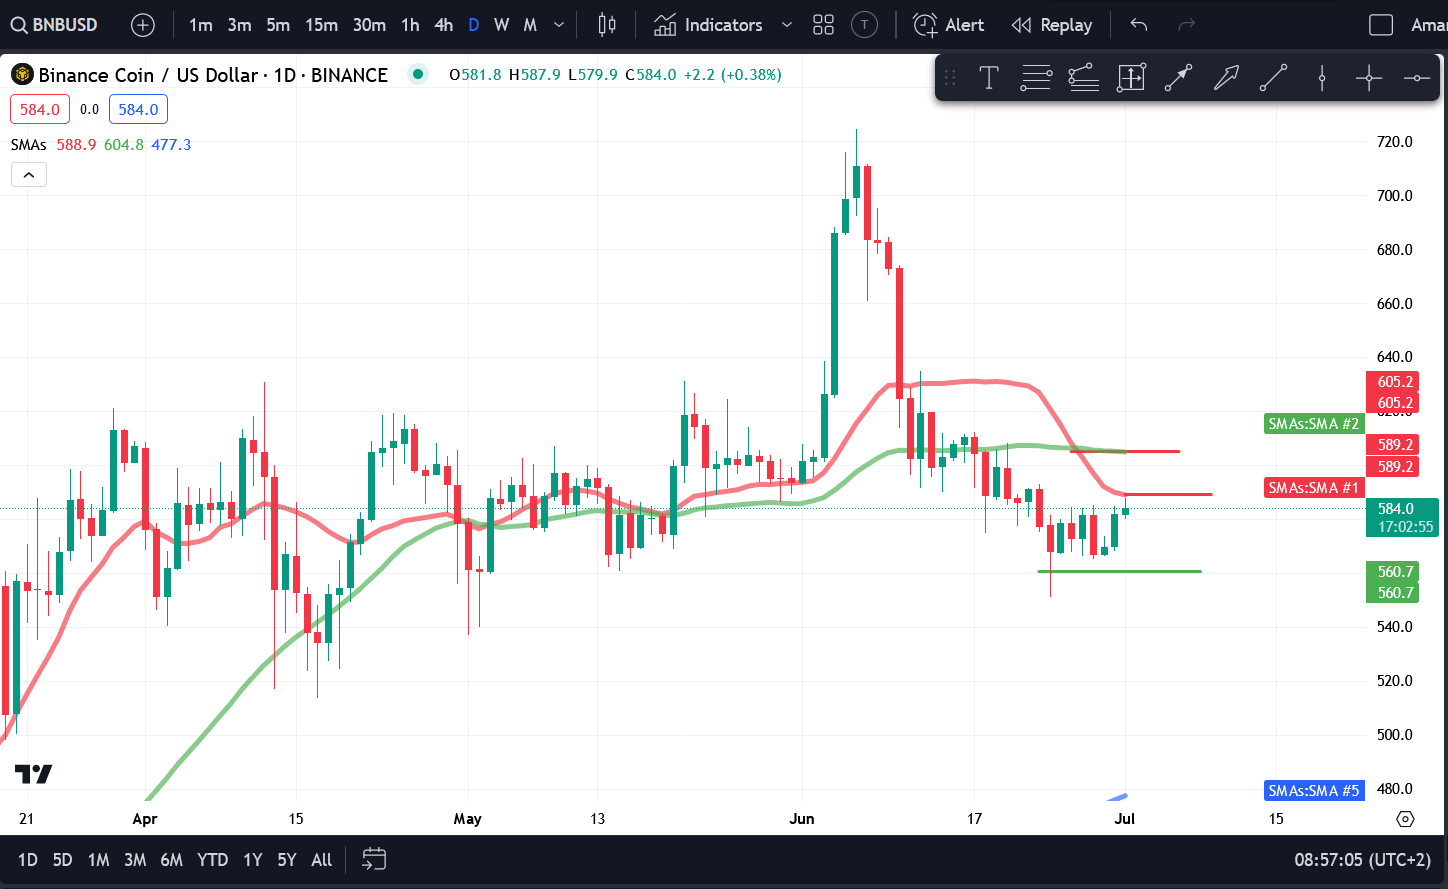
Source: TradingView
As you can see from the price chart, BNB’s support and resistance levels have remained solid so far. If buyers can push the price above the 20-day SMA and $600, we could see a strong push towards $700. However, for this scenario to unfold, BNB would first have to cross the 20-day SMA. A reversal could lead to the support at $560 being tested once again.
Solana (SOL) Price Analysis
Solana (SOL) price soars following VanEck's spot ETF subscription. The cryptocurrency has been strong throughout the past week, surging after hitting a low of $122 on Monday. SOL made a strong recovery from this point, closing at $132.33, just below its 200-day SMA. SOL rose 3.22% above its 200-day SMA on Tuesday to settle at $136.59 after failing to top $140. There was a very volatile trading session on Wednesday, with buyers attempting to push SOL above $140 and sellers attempting to defend these positions and push SOL below $135.

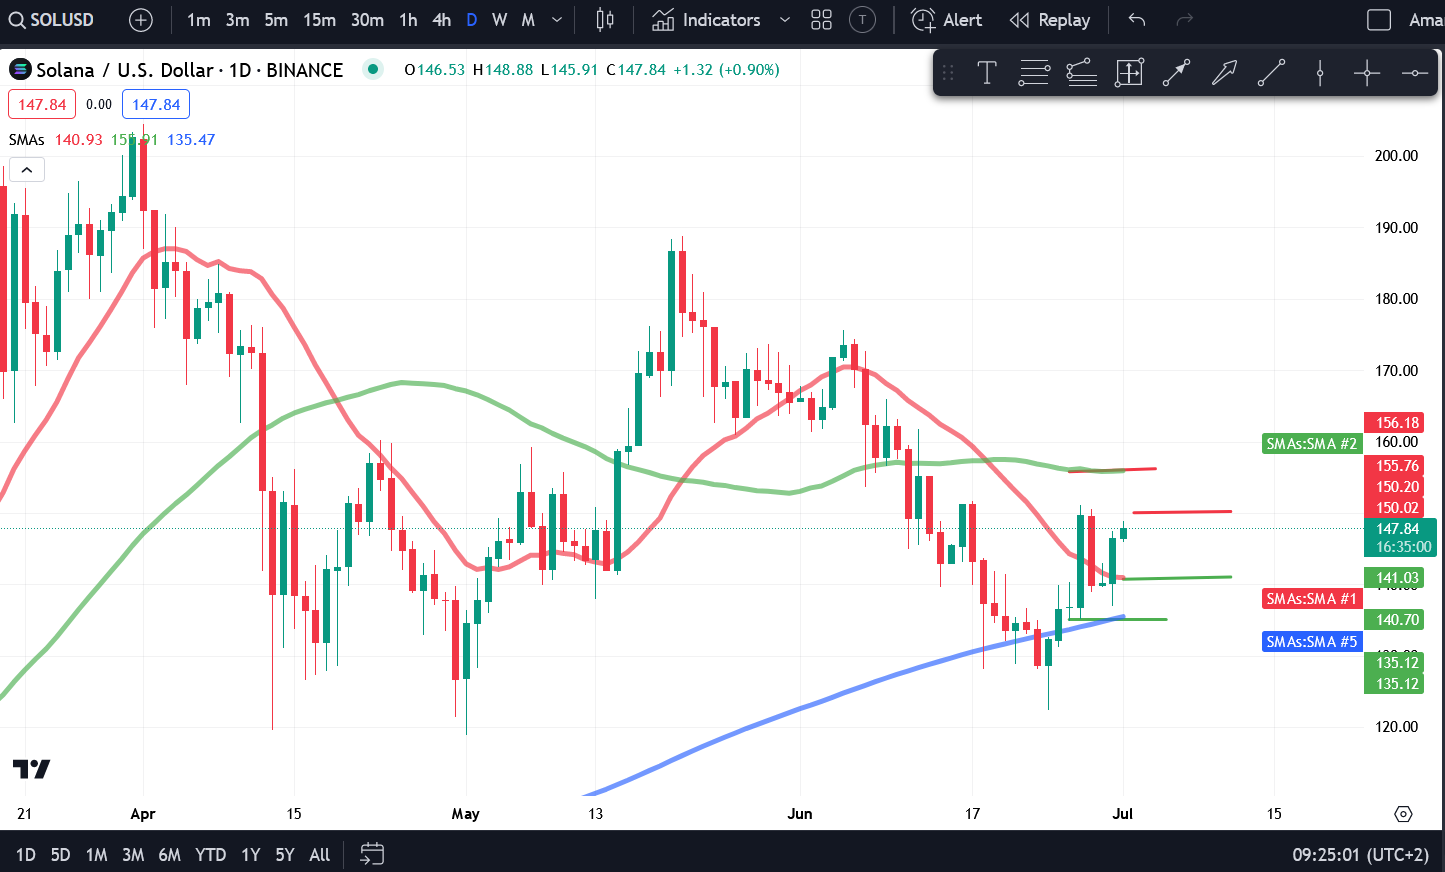
Source: TradingView
SOL recorded a significant increase of 9.40% on Thursday, a sharp increase above its 20-day SMA. However, due to significant selling pressure at $150, SOL was unable to maintain its bullish momentum and settled at $149. SOL suffered a significant decline of 6.51% on Friday, trading below its 20-day SMA at $139.90 and below $140. SOL attempted to move back above the 20-day SMA on Saturday but failed, recording only a small increase. However, on Sunday, SOL appeared to be firmly in bullish territory as the price surged 4.57% before surging above the 20-day SMA to $146.52. In the current session, SOL is expected to rise by almost 1% as it is expected to break above the important $140 level.
There are a few important levels to consider when it comes to future price action. SOL is supported at $140 and $135. If bearish sentiment returns, SOL could fall to either of these two levels. However, if SOL can close above $150, we could see the price move to the $170-$180 area.
Polkadot (DOT) Price Analysis
Polkadot (DOT) had a strong recovery last week, bouncing back after losing the crucial $6 level. Since then, the cryptocurrency has gained nearly 13%. DOT started to face significant selling pressure on Monday as sellers attempted to push the price down to $5.50. However, buyers were present at this level, allowing DOT to recover and settle at $5.72. DOT continued its upward trajectory on Tuesday, posting a gain of 2.10% as buyers attempted to reclaim the crucial $6 level. However, they were unable to do so, and DOT fell 0.68% to settle at $5.80 on Wednesday.
On Thursday, DOT started strong as the price surged more than 8%, breaking above the 20-day SMA and $6, settling at $6.28. DOT attempted to push above $6.50 on Friday, but as sellers became active at that level, it fell 1.59% to $6.18. On Saturday, the bears tried to push DOT below $6 as selling continued. However, it failed to push below $6, and DOT settled at $6.07, ending the weekend strong as buyers entered the market, pushing the price up 2.31% on Sunday. In the current session, DOT is up 1.93% as buyers again tried to push the price above $6.50.

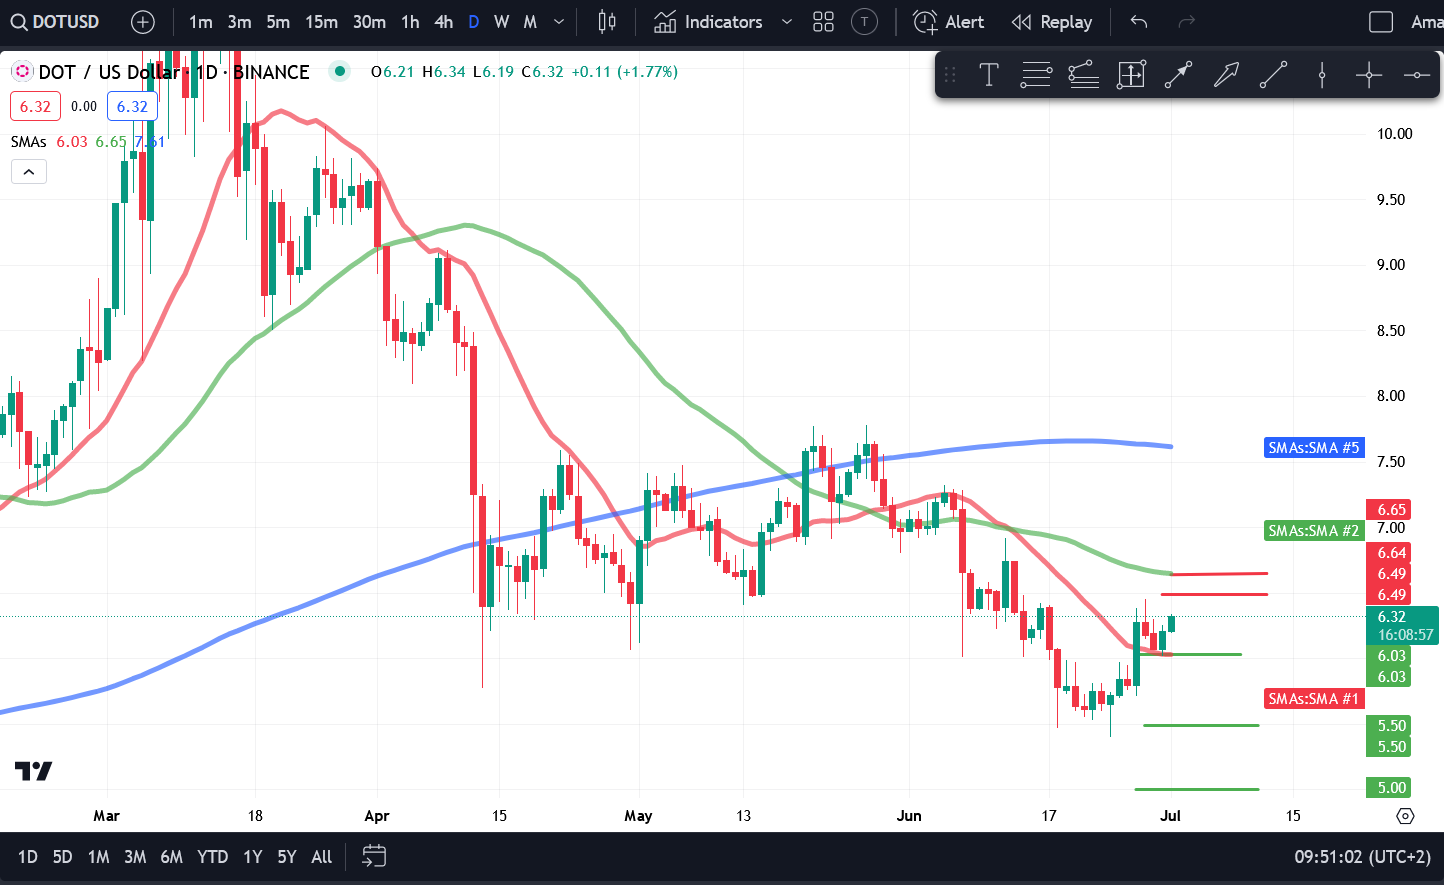
Source: TradingView
As can be seen on the price chart, DOT faces resistance at $6.50 and $6.70. If we can get above this level, we could see a rise to $7. However, if the price is rejected from this level, DOT could fall back to the $6 support level and enter a consolidation period.
Dogecoin (DOGE) Price Analysis
Dogecoin (DOGE) has been trading between $0.120 and $0.130 since June 18, while failing to surpass its 20-day and 200-day SMA. DOGE attempted to break above 200-day resistance on Tuesday after a period of sideways consolidation, moving up more than 6% to $0.126. But the bears fought back, with DOGE falling just over 3% on Wednesday. On Thursday, buyers attempted to break through resistance again. However, it failed to rise above $0.130 and closed at $0.127. On Friday DOGE fell 3.07%, and on Saturday it fell another 1.54%, dropping the price to $0.121. DOGE recovered from this level and closed up 2.56% at $0.124 on Sunday. In the current session, DOGE is trading at $0.125, up 1.77%.

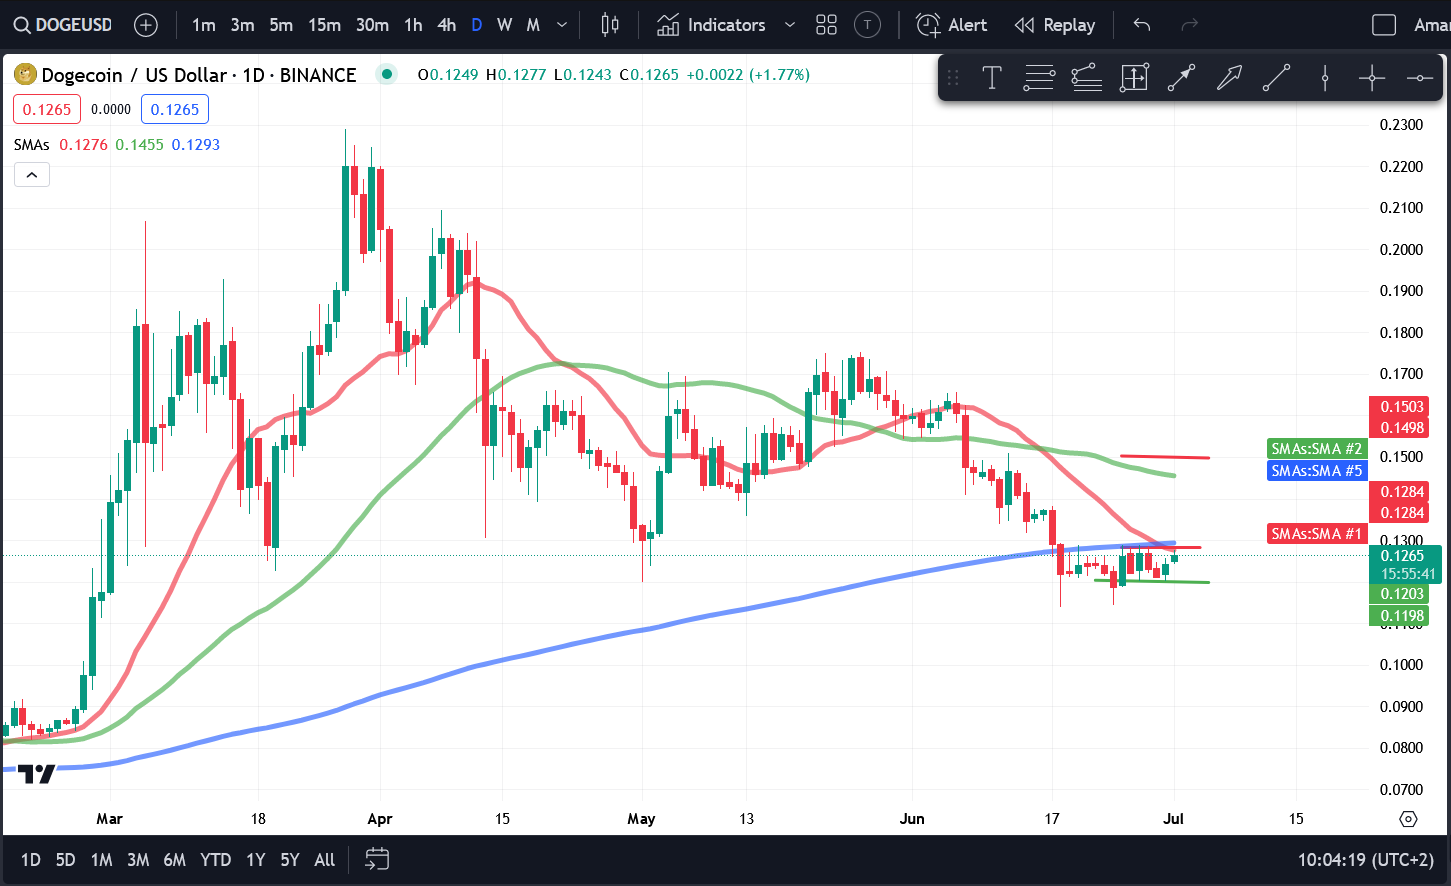
Source: TradingView
Cardano (ADA) Price Analysis
Cardano (ADA) was relatively strong last week, holding support at $0.37, allowing buyers to enter the market. ADA rose 3.70% to $0.39 on Tuesday. However, it failed to break above $0.40 and fell nearly 2% on Wednesday to $0.38. Similar moves were seen on Thursday and Friday as buyers and sellers struggled for control.

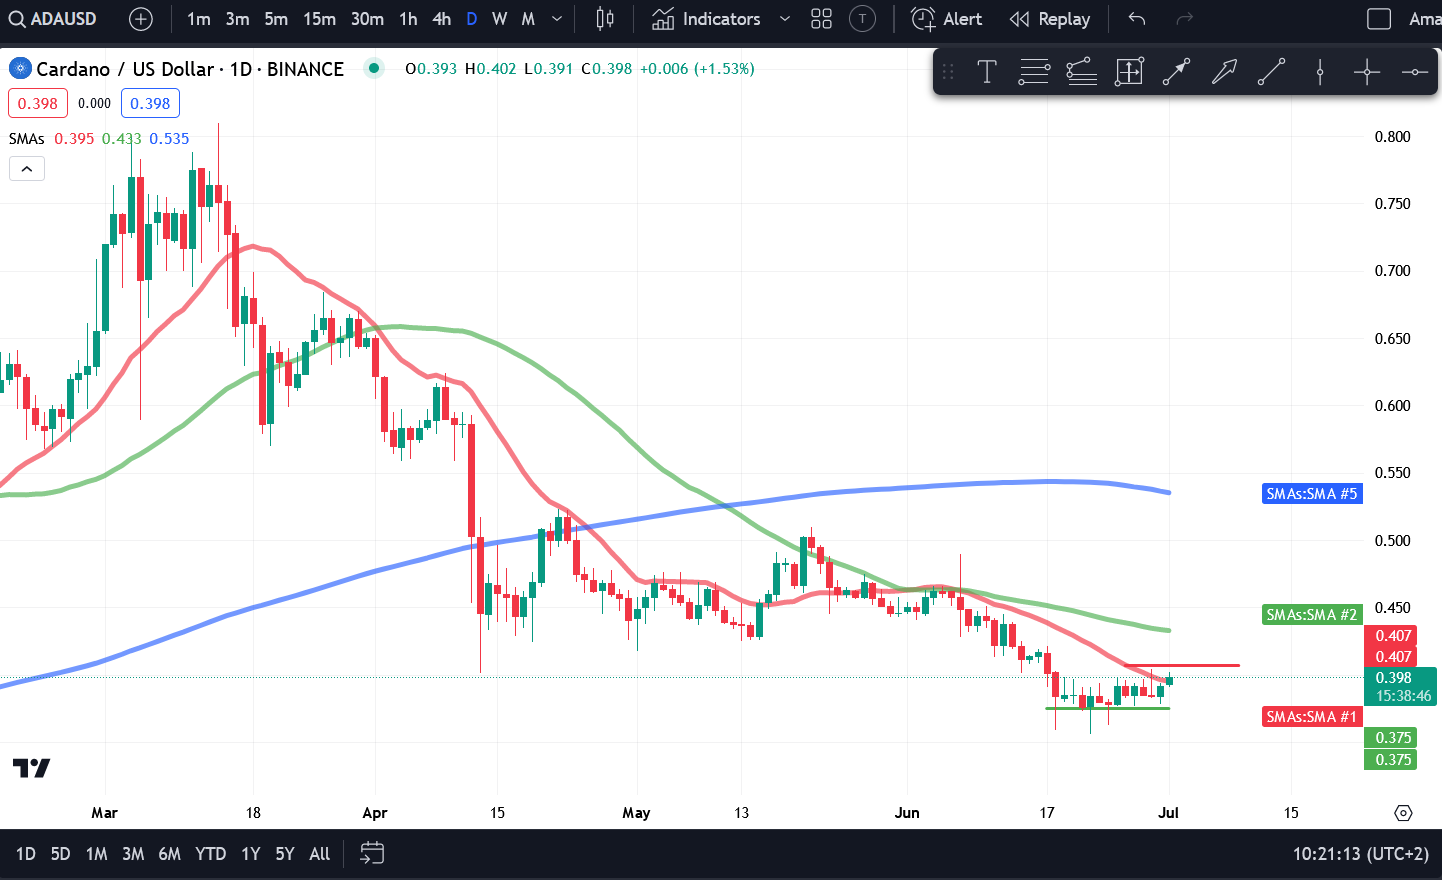
Source: TradingView
Over the weekend, buyers attempted to push ADA above its 20-day SMA, with the price reaching an intraday high of $0.40. However, the sellers regained control and drove ADA back down to $0.38. ADA started Sunday on a positive note, moving to $0.39. In the current session, ADA sits at $0.40 as buyers attempt to push it above this important level. If ADA can maintain this bullish momentum, we could see the price rise to $0.45.
Uniswap (UNI) Price Analysis
Uniswap (UNI) suffered a sharp decline on Friday after failing to surpass its 50-day SMA of $9.50. The price fell 5.39%, falling below the important support level of $9. However, sellers were able to drive UNI lower on Saturday, with the asset falling 1.69% to $8.83. Buyers could enter the market at this level with the 200-day SMA acting as a dynamic support level.

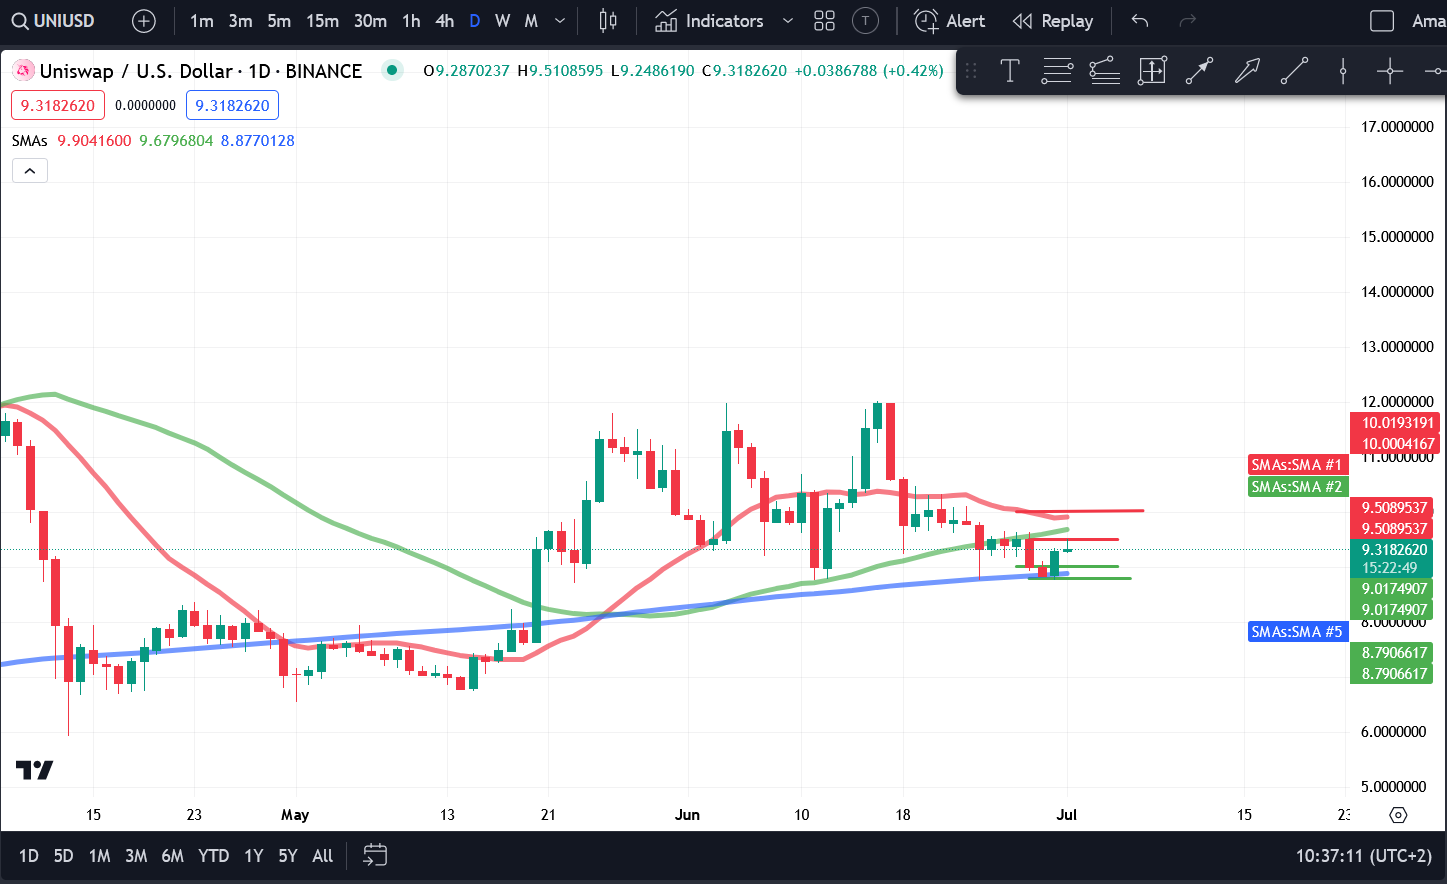
Source: TradingView
As a result, UNI recorded a huge rally on Sunday, rising 5% to reclaim the important $9 level and settle at $9.27. In the current session, UNI price is at $9.33 as buyers and sellers struggle to control the session. UNI is facing two levels of resistance, one at $9.50 and the other at $10. If UNI reclaims $9.50, we can see an upside move towards $10. However, if sellers re-open the current session, selling pressure could push UNI back to the $9 support level.
Disclaimer: This article is provided for informational purposes only. It is not provided or intended as legal, tax, investment, financial or other advice.
Investment Disclaimer


