


index
Bitcoin (BTC) has broken through $64,000 and is showing tremendous strength as buyers return to the market. BTC’s recent surge shows strong demand even at lower levels, with the cryptocurrency seeing over $1.3 billion in weekly inflows, according to data from CoinShares.
If the bullish sentiment continues, BTC and other major altcoins could see significant upside, possibly even reaching new highs.
Major cryptocurrencies record significant inflows
Bitcoin (BTC) has surged more than 12% over the past seven days, with major cryptocurrencies rallying as bulls return to the market. The world’s largest cryptocurrency recorded its fifth-largest weekly inflow of $1.35 billion. At the same time, Ethereum (ETH) saw weekly inflows of $72 million amid growing anticipation of a spot Ethereum ETF launching in the United States. According to cryptocurrency analytics firm Santiment, small BTC traders have been selling their holdings as prices have fallen. BTC whales, on the other hand, have been buying the dip and amassing large amounts of the asset. According to data from IntoTheBlock, BTC whales have bought more than 71,000 BTC during the recent price drop.
Every trader is asking two questions: How long will the BTC rally last? And will it be able to make a new all-time high? Traders may be tempted to take profits near overhead resistance, and this could happen again. This is why BTC may struggle to make a new all-time high, and if it does go higher, it will likely face significant resistance near $65,000 and $70,000.
Bitcoin (BTC) Price Analysis
Bitcoin (BTC) has been quite bullish since the weekend, breaking above $60,000. However, the bullish momentum is showing signs of weakening as bears push back, and there is significant selling pressure at higher levels. This is evident on the price chart, where BTC is shown in red during the ongoing session as sellers push back. After a mixed week, BTC rose 0.99% to $57,972 in a session marred by high volatility. Buyers continued to control the market over the weekend, with BTC up 1.71% on Saturday and 3.06% on Sunday, ending the weekend above $60,000. Sunday’s gains saw BTC close above its 200-day and 20-day SMAs at $60,750.

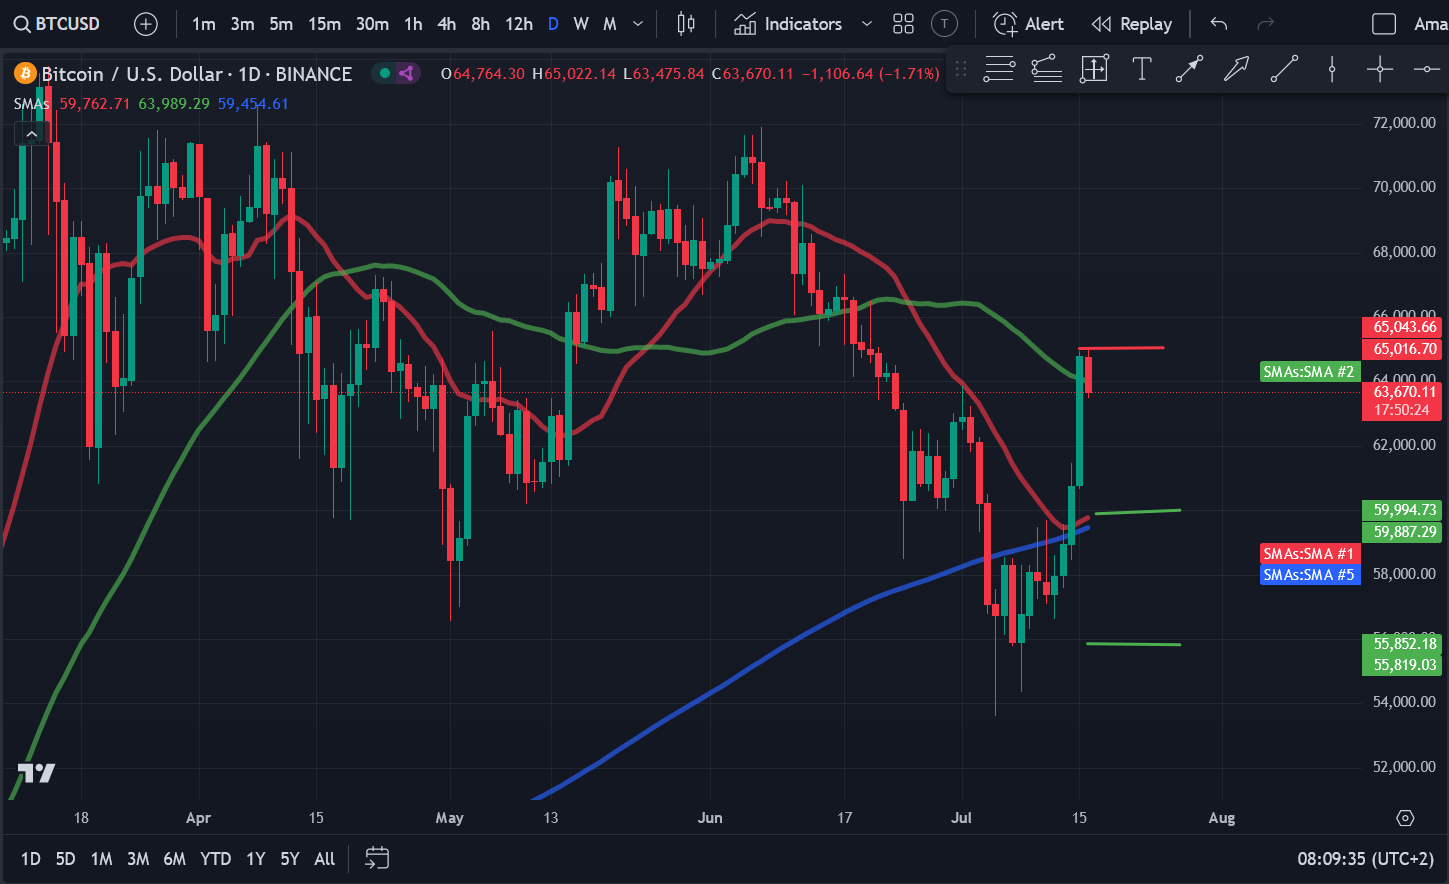
Source: TradingView
The week started with an impressive surge of 6.63% for BTC. This led to a price breakout above $64,000 and a settlement at $64,776. However, with the bears expected to defend the $65,000 level and some profit-taking expected to occur, BTC fell into the red during the ongoing session as the bulls lost steam. Currently, BTC is down almost 2% as sellers try to push the price down to $60,000. If BTC can recover and push back above $64,000, we could see the price testing the $65,000 resistance. A breakout of this level could trigger a rally towards $70,000.
However, if the bears can push the price lower, it would indicate a sell-off in the rally, so BTC could fall to $60,000.
Ethereum (ETH) Price Analysis
Ethereum (ETH) has seen a notable bounce with strong demand near a critical support level. However, bulls may have to wait a bit longer to break $3,500, with ETH currently down 1.76%. Looking at the price chart, ETH has surged after a prolonged bearish trend, dropping to $2,824. However, the price has since bounced back to the $3,000 level. The bullish sentiment has intensified in recent days, with anticipation of a spot Ethereum ETF launch growing.

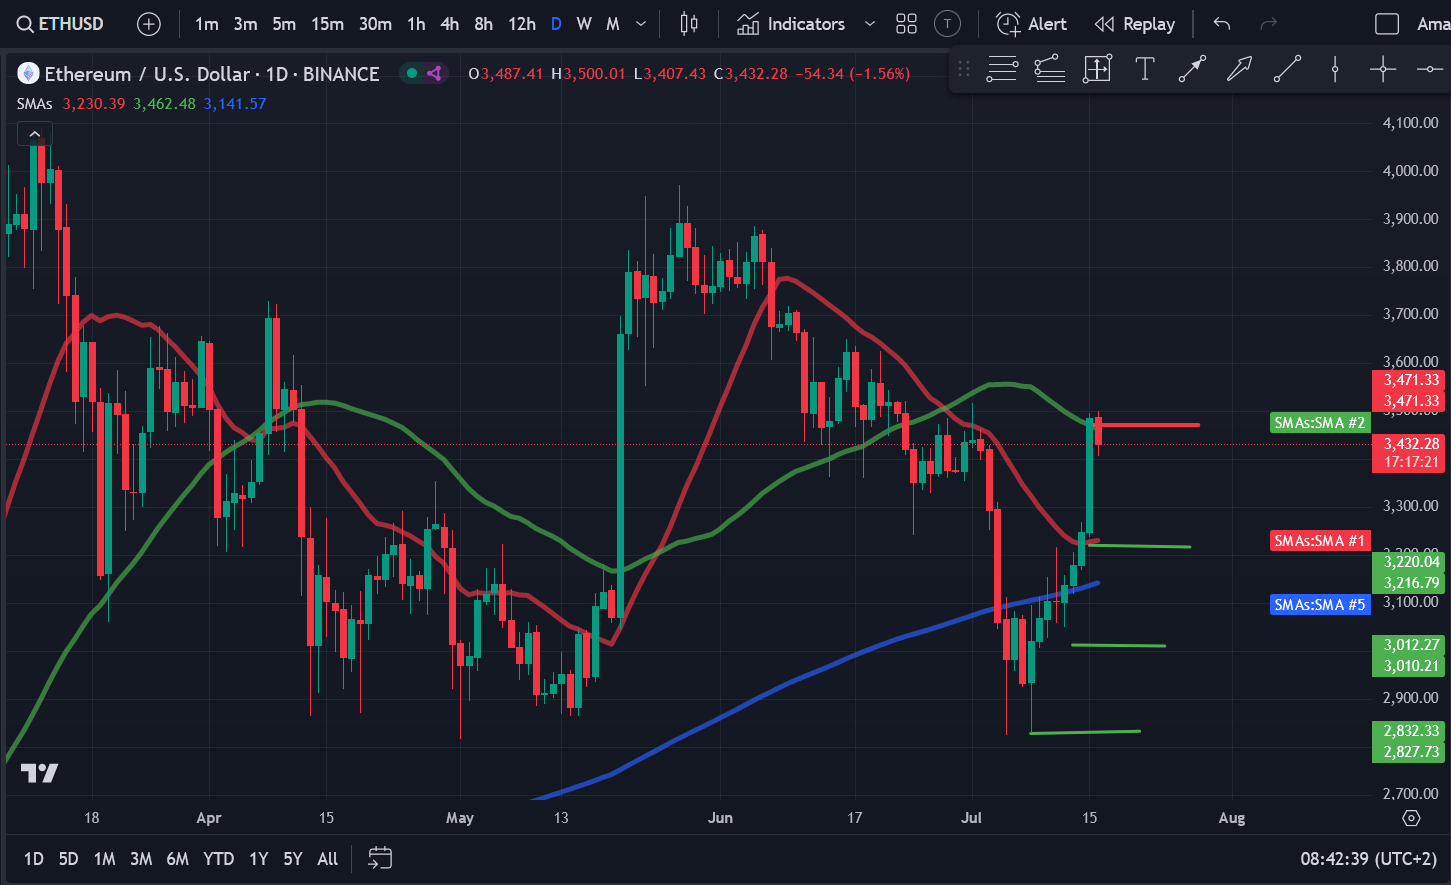
Source: TradingView
As you can see from the price chart, after experiencing significant volatility on Thursday, ETH rose 1.12% above its 200-day SMA on Friday to reach $3,136. Over the weekend, bulls continued to control the market, with ETH up 1.34% on Saturday and 2.17% on Sunday to close at $3,247. Sunday also saw ETH break above the important 20-day SMA. ETH started the week with a 7.37% surge as the bulls broke above the $3,500 level and the 50-day SMA. However, the bulls began to lose momentum due to strong selling pressure at $3,500, and ETH closed at $3,486. In the current session, ETH is down 1.55% as buyers attempt to push ETH back to its 20-day SMA.
If the bulls regain control, we could see ETH break above $3,500, a level it hasn’t seen since May. However, if the sellers continue to push ETH lower, we could see a drop to $3,000 or $2,850.
Solana (SOL) Price Analysis
Solana (SOL) broke above $150 on the back of optimism and market strength. The cryptocurrency is currently trading above its 20, 50, and 200-day SMAs but is down more than 2% during the current session. However, it showed a notable uptrend over the weekend, rising above $150. SOL rose 2.78% to $139.60, above its 200-day SMA. Another uptrend occurred on Saturday, pushing SOL above its 20-day SMA to $142.04, before rising 4.05% to settle just below its 50-day SMA at $147.79 on Sunday.

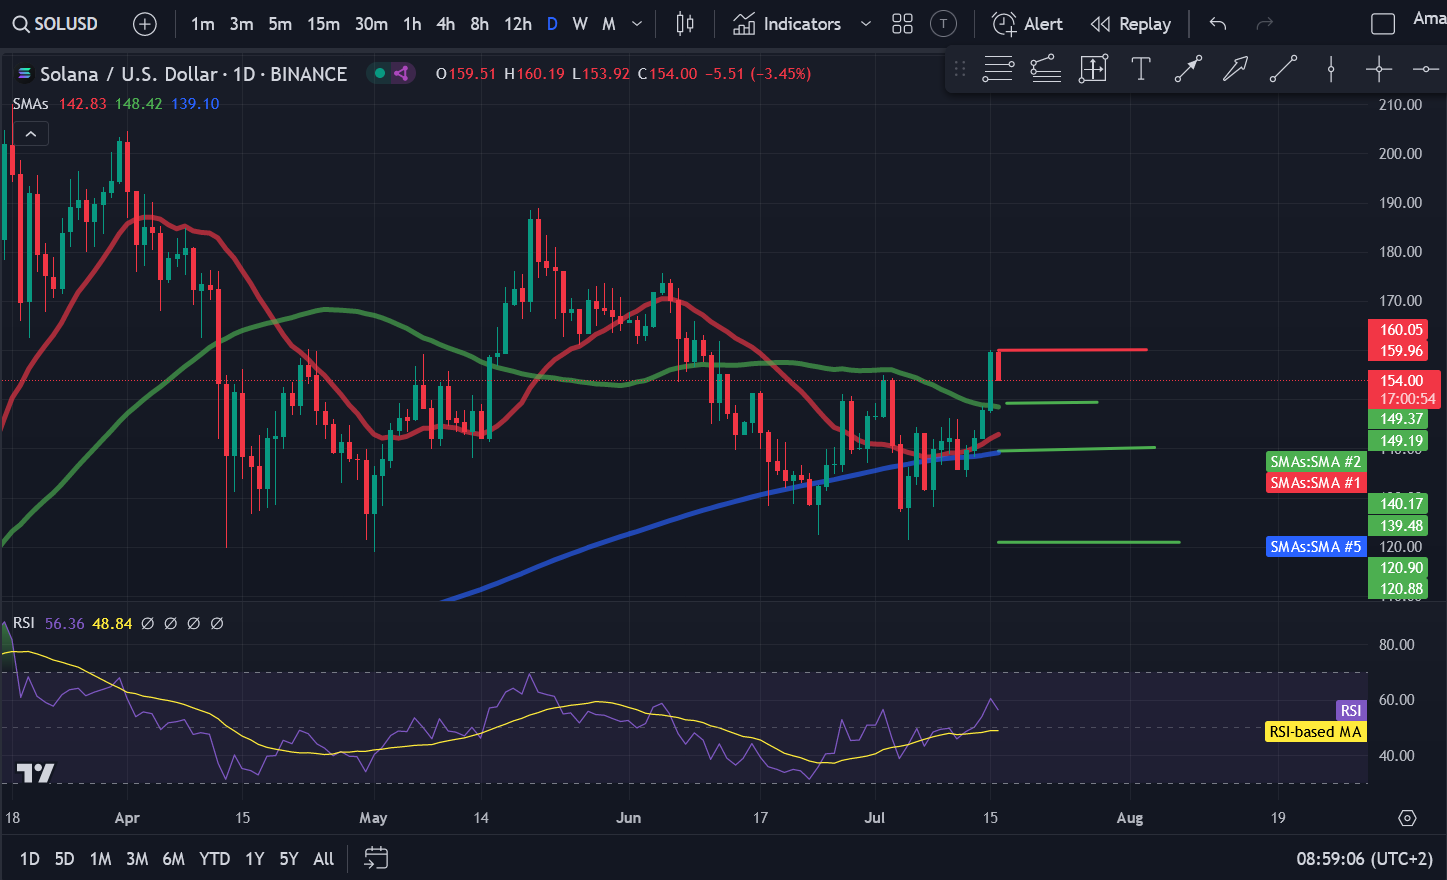
Source: TradingView
SOL broke above the 50-day SMA and $150 on Monday, rising 7.93% to $159. However, it faced significant resistance at $160, resulting in a downtrend in the ongoing session. Currently, SOL is down 3.30% and trading at $154. If the price stays above $150 and consolidates, we can see SOL testing $160 again. A break above this level could start a rally above $170. The RSI is currently at 56, indicating that it is neither overbought nor oversold, giving SOL room for a price rally.
Cardano (ADA) Price Analysis
Cardano (ADA) has been steadily rising to $0.45 over the past week. The cryptocurrency broke its 20-day SMA on Wednesday, rising to $0.38. By Friday, ADA had gained 6% before breaking above $0.40, settling just below its 50-day SMA at $0.41. On Saturday, it broke above its 50-day SMA, rising 6% to $0.44. However, strong resistance at $0.45 allowed sellers to push ADA to $0.43 on Sunday, down 2.26%.

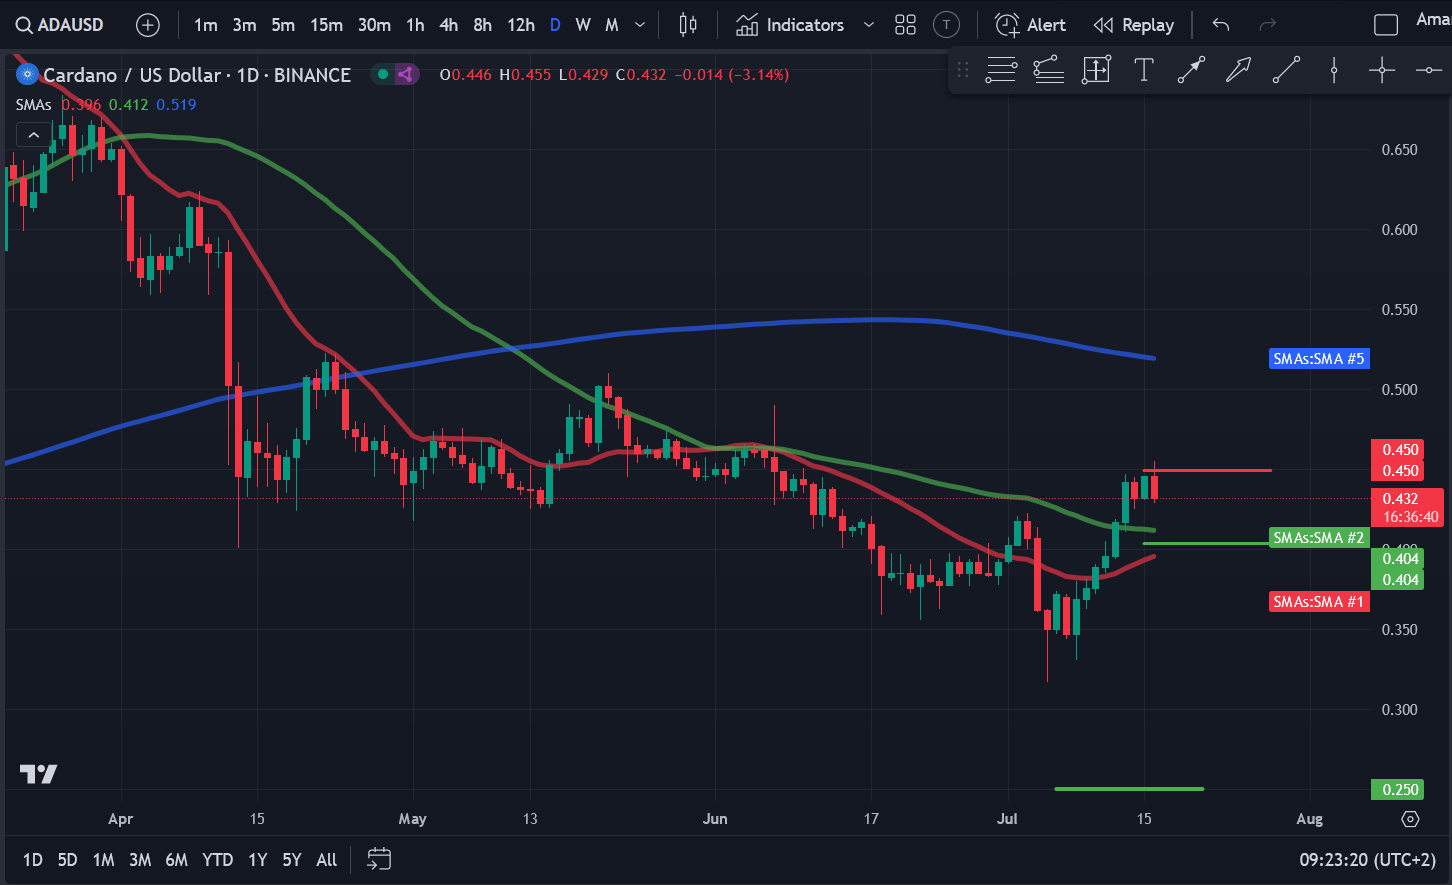
Source: TradingView
This week started with buyers trying to push ADA above $0.45. However, they were unable to do so, and ADA settled back at $0.44. In the current session, sellers are in control, with ADA down 2.39%. If ADA can break above $0.45 and consolidate, we could see a rally towards $0.50. However, if sellers are in control, we could see a drop to $0.40.
Avalanche (AVAX) Price Analysis
Avalanche (AVAX) showed significant volatility last week as it attempted to move above the 20-day SMA, which acted as a dynamic resistance level. AVAX was able to stay above $25, and traded in a narrow range the week before. AVAX recorded a gain of just over 3% on Friday, rising to $25.99. However, it turned red again on Saturday, and after a slight decline, it rose 1.87% on Sunday, ending the weekend above $26.

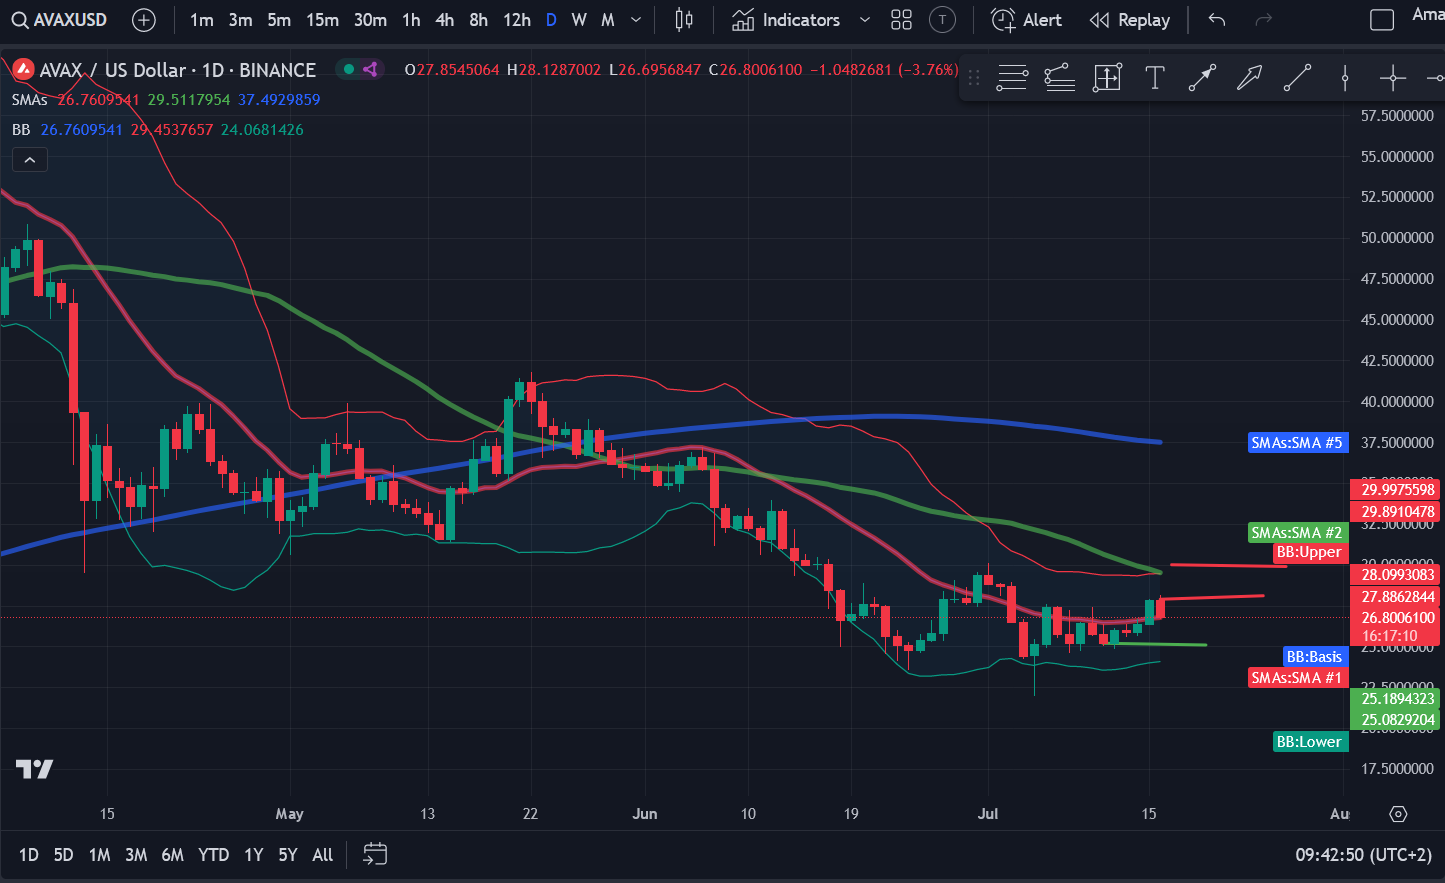
Source: TradingView
The week started with bulls pushing AVAX above the 20-day SMA, which price broke above and rose 5.61% to $27.84. However, the bulls lost momentum as the price approached $30, and AVAX turned red again during the ongoing session. AVAX is currently down 3.36%, trading at $26.89. Looking at the price chart, we can see that AVAX is experiencing significant volatility, as shown by the Bollinger Bands. If sellers push AVAX lower, it could slide below the 20-day SMA to $25.
Uniswap (UNI) Price Analysis
Uniswap (UNI) has been in a steep downtrend, down nearly 7% in the current session. UNI has been quite bullish over the weekend, posting significant gains as the crypto market turned bullish. The cryptocurrency broke through $8 on Friday, rising 3.28%, before settling at $8.09. UNI continued its bullish momentum over the weekend, rising 0.99% on Saturday and 2.80% on Sunday, reaching $8.60, settling just below its 20-day SMA. UNI broke through its 20-day SMA on Monday, reaching $8.60.

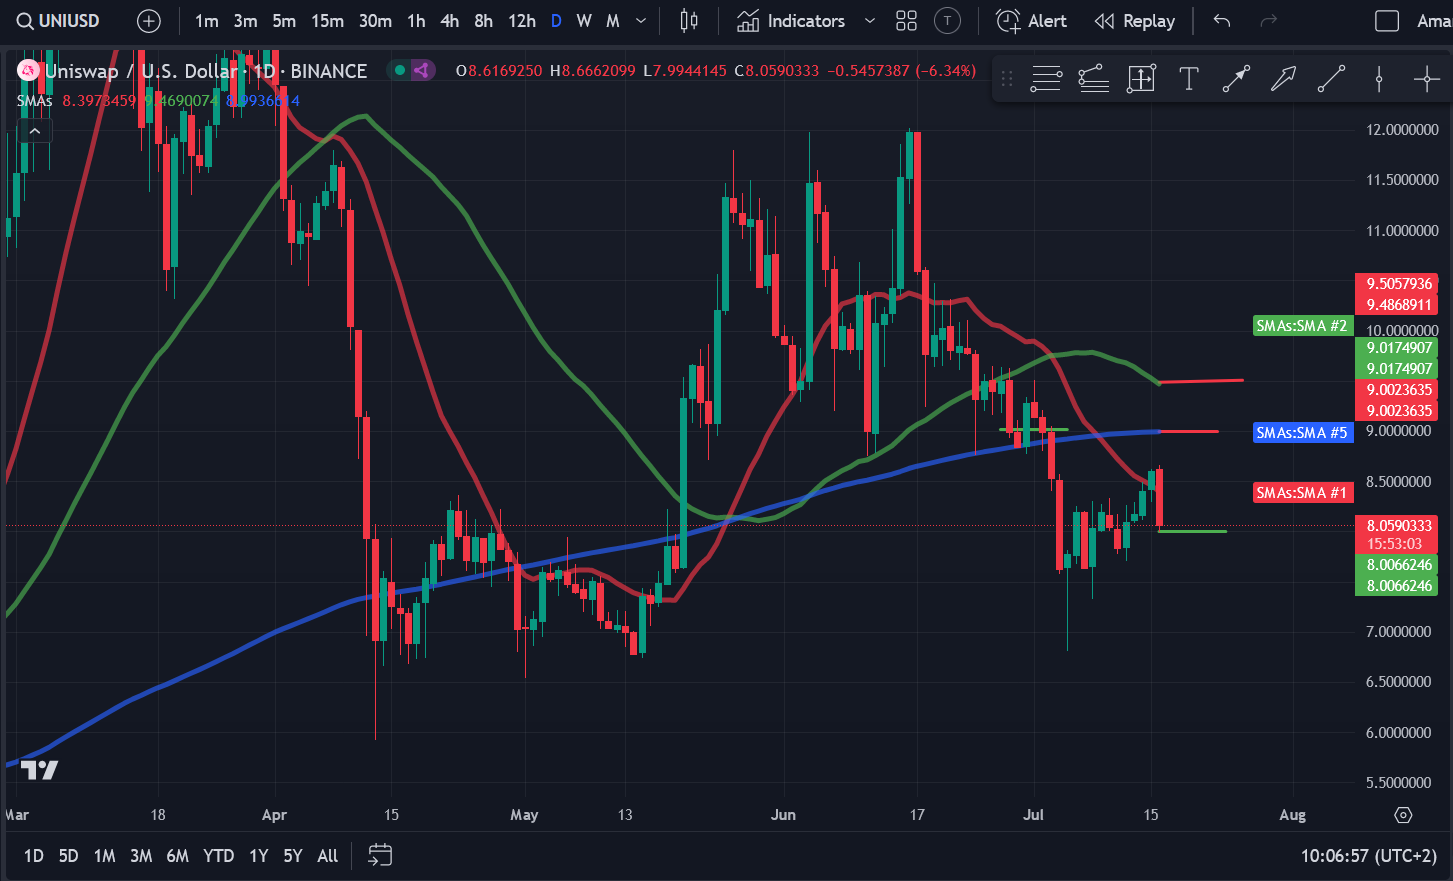
Source: TradingView
However, UNI failed to push higher and bearish sentiment returned during the ongoing session as the price faced strong resistance at higher levels. Currently, UNI is trading at $8.05, down more than 6%. If sellers continue to control the session, UNI could push below $8. UNI faces several important resistance levels that it needs to overcome for a sustained uptrend. These levels are $8.60, $9, and $9.50.
Cosmos (ATOM) Price Analysis
Cosmos (ATOM) has recovered nicely after dropping to $5.09 on July 5th. The cryptocurrency was up over 8% last week, but the current session has seen increased selling pressure. ATOM recovered $6 on Friday after rising 3.59%, taking the price to $6.15. The weekend saw only minor gains of 0.92% on Saturday and 0.24% on Sunday, leaving the price at $6.23, just below the 20-day SMA. ATOM broke above the 20-day SMA on Monday, rising 4.41% to reach the important level of $6.50.

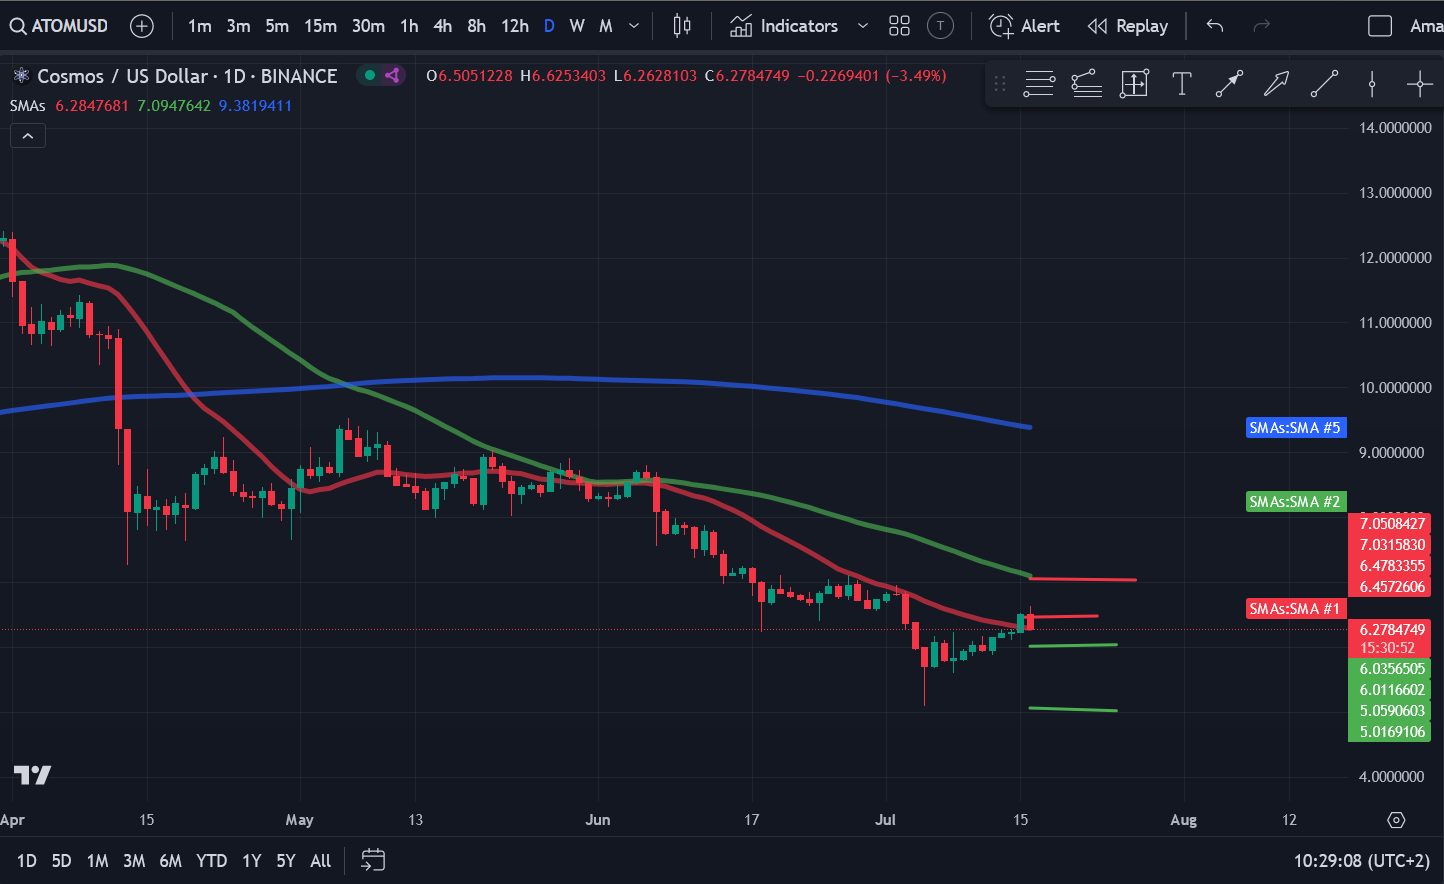
Source: TradingView
However, it faced significant selling pressure at this level, which resulted in it falling back into the red during the current session. ATOM is down more than 3% during the current session, and is at $6.29. If ATOM continues to decline, it could move back to $6. If it can consolidate above $6, it would indicate demand at lower levels. To relieve the selling pressure, ATOM needs to consolidate above the 20-day SMA and push above $7 and the 50-day SMA.
Disclaimer: This article is provided for informational purposes only. It is not provided or intended to be legal, tax, investment, financial or other advice.
Investment Disclaimer


