


index
Polkadot (DOT) recorded a significant decline of nearly 7% on Friday as sellers drove the price below $7, a critical level for the asset.
DOT fell to $6.06, falling below the support level before beginning a phased recovery before rising to $6.65. The current session sees DOT remaining in the red as sellers remain in control.
Polkadot (DOT) records sharp decline
Just as it looked like Polkadot (DOT) might recover, it recorded a sharp decline, sending the asset into a downward spiral once again. DOT, which ended last week in the red, rose above $7 on Saturday to $7.06 before falling to $6.99 on Sunday. However, DOT started the week on a positive note despite experiencing extremely high levels of volatility. This volatility pushed DOT to a high of $7.18 before pushing it back to $7. Looking at the price chart, we can see that DOT has strong support at this level thanks to its 50-day SMA.
On Tuesday, DOT rose 2.41% to $7.17, and on Wednesday it rose 1.06% to $7.25. However, with the 20-day SMA acting as resistance at this level, DOT fell into the red and was trading at $7.13, down 1.57% on Thursday. Remember, at this point, DOT had support at the $7 level. However, this support level was broken on Friday after DOT plunged 6.75% to $6.65, with sellers taking control of the market and driving the price down to $6.06. However, as buyers entered the market, DOT was able to break above the $6.40 support level and settle at $6.65. DOT is down 2.70% in the current session and is priced at $6.47.
Can Polkadot (DOT) stay above support levels?
If you look at the Polkadot (DOT) price chart, you can see a sharp decline over the past session. Friday's sharp decline forced sellers to break the $7 support level, sending DOT into free fall. DOT eventually agreed to $6.65. So where does DOT go from here? DOT supports $6.40, a level it has maintained over the previous three rounds. Violation of this level could result in DOT dropping to $6. If DOT recovers, it could return to $7. However, it remains to be seen whether it can overcome the resistance levels of $7.20 and $7.50.

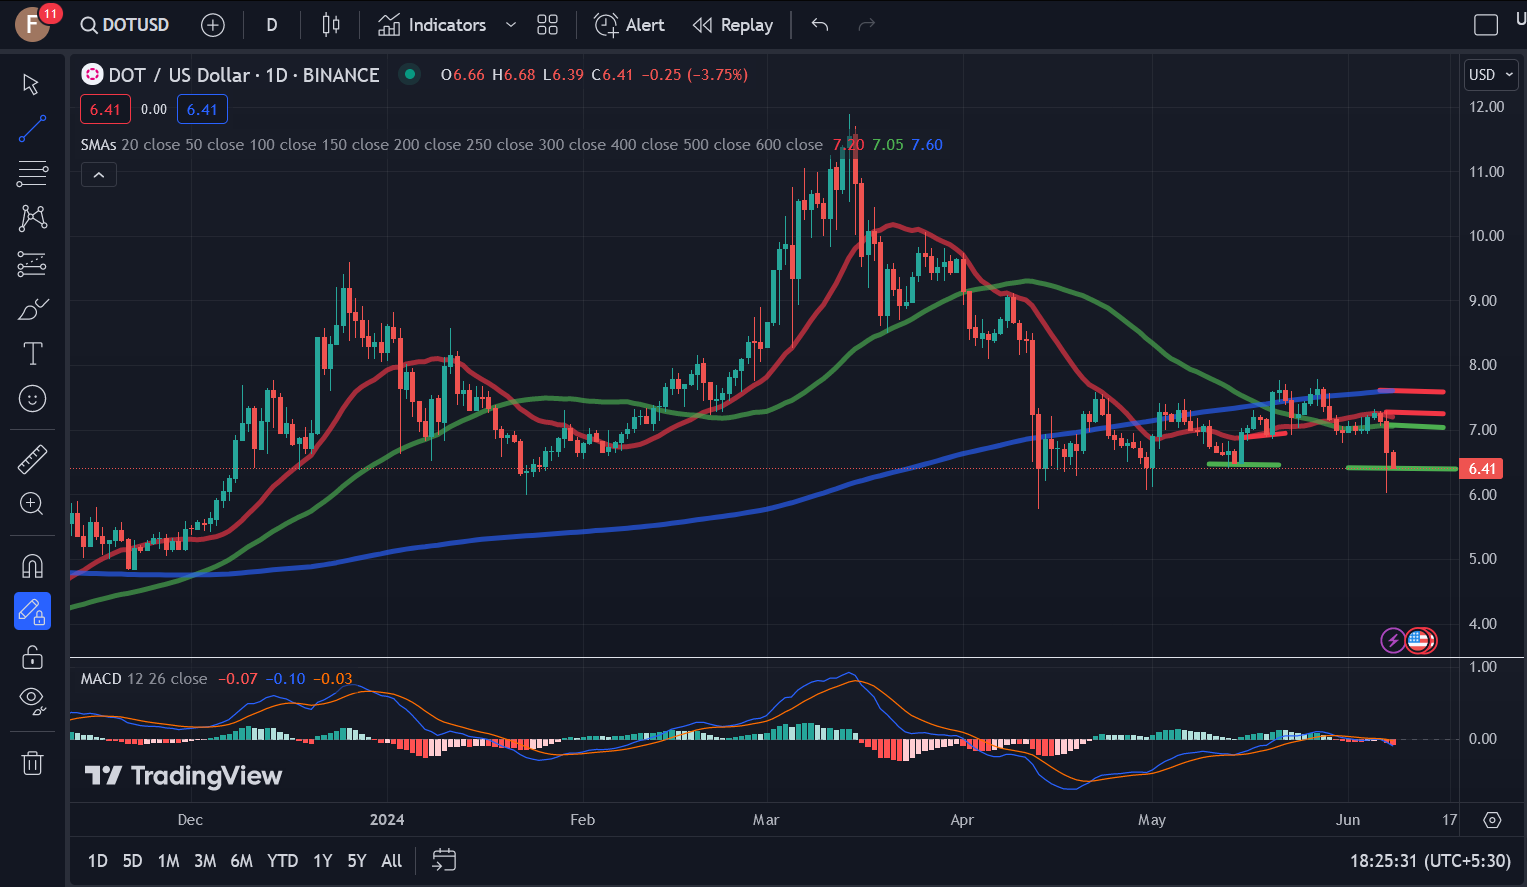
Source: TradingView
Looking at DOT's indicators, we can see that the MACD has turned bearish, indicating that DOT may be experiencing selling pressure and a return to bearish sentiment.
Disclaimer: This article is provided for informational purposes only. It is not provided or intended to be used as legal, tax, investment, financial or other advice.
Investment Disclaimer


